Univariate Data (One Variable)
Analysing
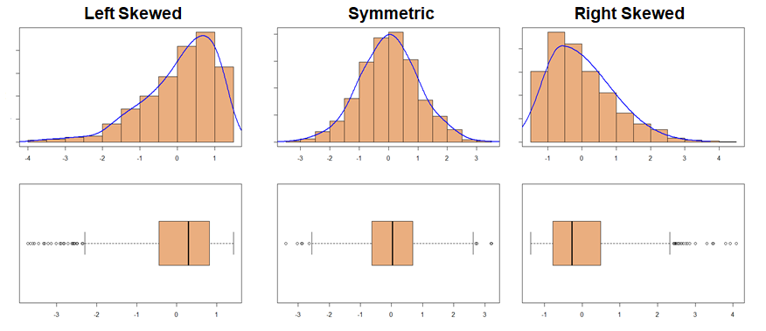
- Overall Pattern
- Shape
- Skewness
- Left Skewed: Mean < Median < Mode
- Symmetrical: Mean = Median = Mode
- Right Skewed; Mead > Median > Mode
- Peaks
- Skewness
- Centre
- Mean, Median, Mode
- Spread
- IQR
- Standard Deviation
- Range (Biggest value - smallest value)
- Shape
- Deviations
- Outliers
- Defined as more than IQR outside the IQR (e.g. IQR)
- Outliers
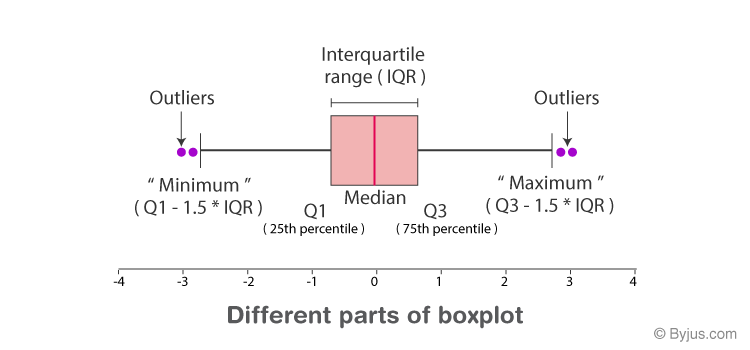 A cross in the middle of the box is the mean
Five number summary
The five numbers are: Smallest, Q1, Q2, Q3, Largest
Bivariate Data (Two Variables)
Deterministic vs Statistical
- Variables that have a deterministic relationship
- Given the value of one variable, the exact, unique value of the other variable can be calculated
- e.g. Relationship between Fahrenheit and Celsius
- Statistical or non-deterministically related variables
- Given the value of one variable, the average value of the other variable can be calculated
Analysing
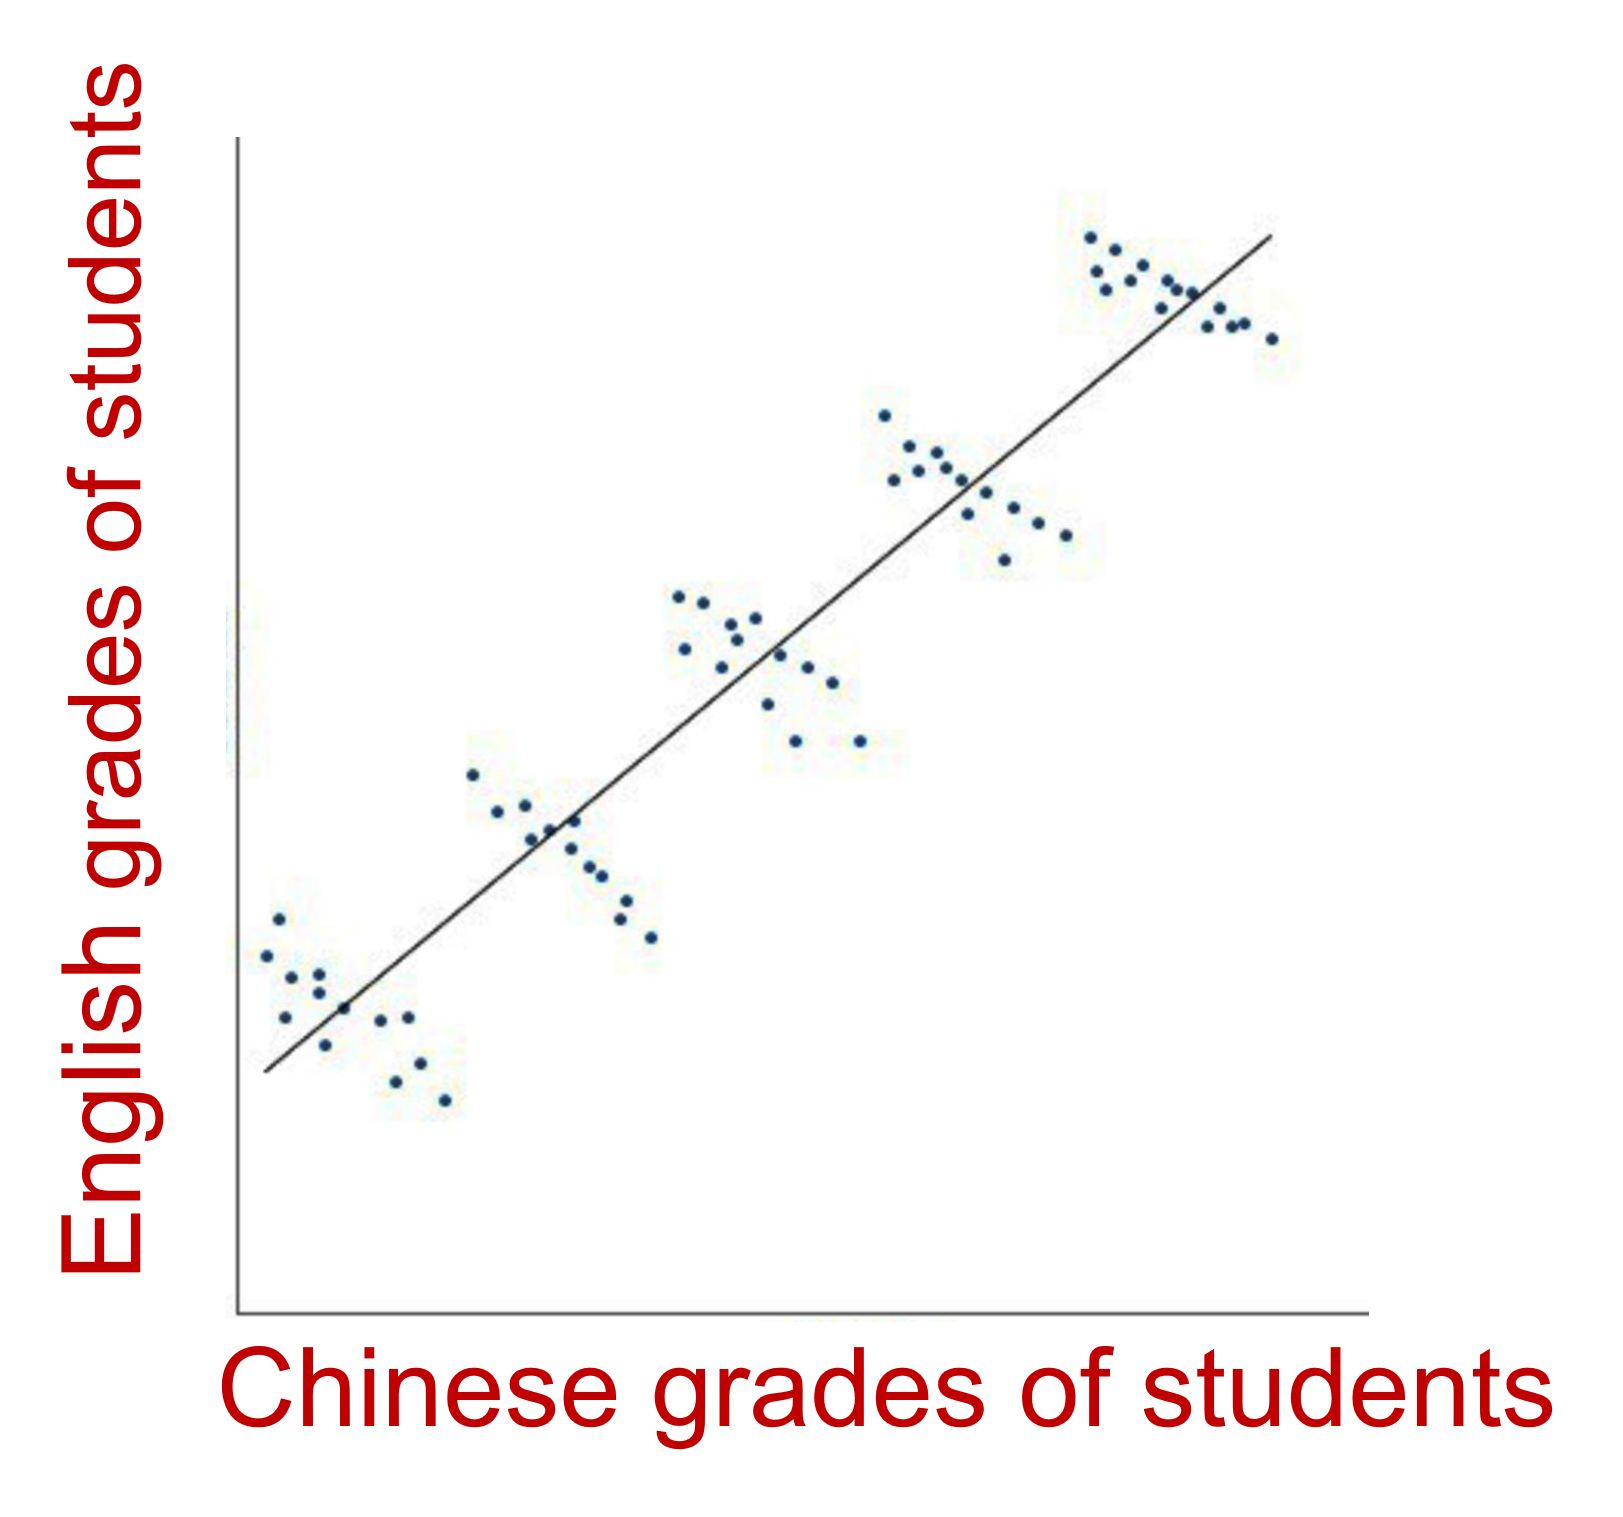
- Overall Pattern
- Direction
- Positive/negative relationship or no relationship (Correlation Coefficient r)
- Form
- Linear, non-linear, quadratic, exponential
- Strength
- Strong, weak, moderate (Correlation Coefficient r)
- Direction
- Deviations from the pattern
- Outliers
- No common way to identify such data points
- Outliers
Predicting
- To predict A using B, we need to use the equation of the regression line of A against B
- i.e. can only predict the y axis value from the x axis value
- The input value to predict must be within range of the dataset for the predicted value to be valid
Correlation Coefficient r
- The measure of the linear association between two variables ()
- The sign of is the direction of association
- means positive association, so when one variable increases, the other will tend to increase
- The magnitude of is the strength of the association
- or : perfect [+ve/-ve] association
- or : Strong [+ve/-ve] association
- or : Moderate [+ve/-ve] association
- or : Weak [+ve/-ve] association
- : No association
- To compute
- Where is the standard deviation of and is the mean of
- Note: is the standard unit for the th
- , where is the gradient of the regression line
- Properties
- Not affected by:
- Interchange of axes
- Addition of numbers
- Multiplication of +ve numbers
- Not affected by:
Ecological Correlation
Computed based on aggregates (groups of individuals) rather than on individuals
- Ecological Fallacy
- Trends observed at aggregate level → Inferences at individual level
- Atomistic Fallacy
- Trends observed at individual level → Inferences at aggregate level
- Trends observed at individual level → Inferences at aggregate level